
Next: Invoices and Payments Management Up: Order Management Previous: Returning an item
Sales Statistics
Sales management
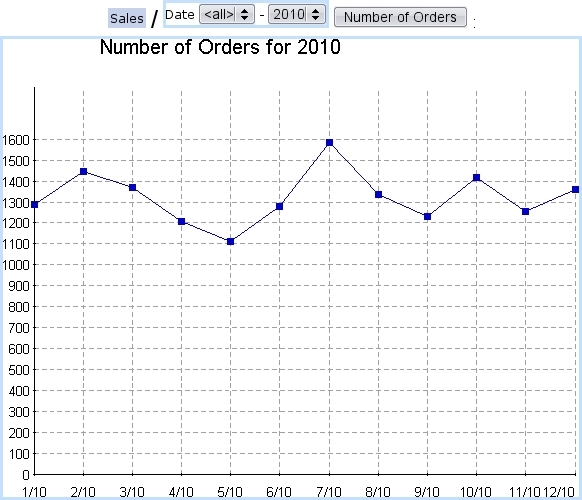
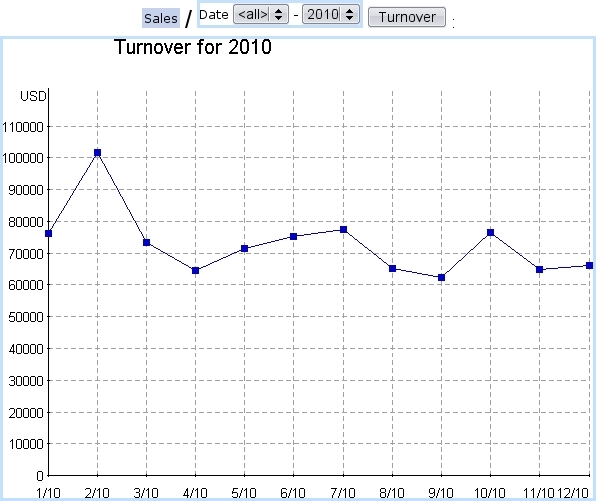
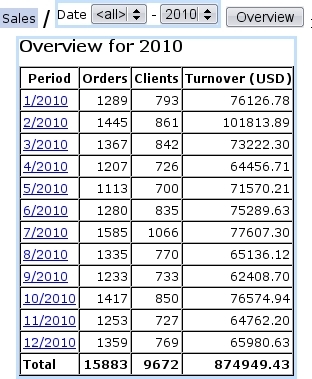
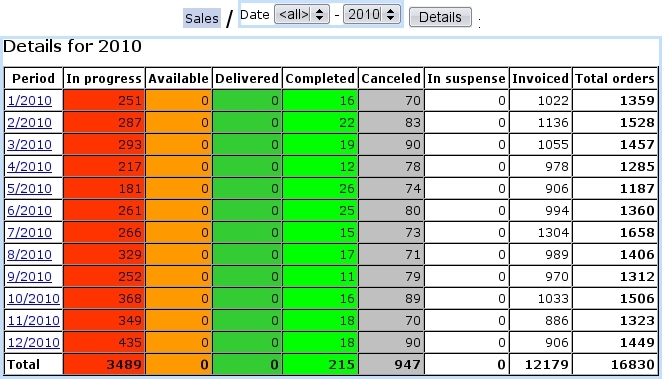
Blue Chameleon also allows you to get a statistical view of your sales through time, via ![]()
![]()
![]() . Statistics can be processed and displayed in a monthly or yearly way, with two kinds of graphs, number of orders and turnover and two kinds of tables, overview and order details.
. Statistics can be processed and displayed in a monthly or yearly way, with two kinds of graphs, number of orders and turnover and two kinds of tables, overview and order details.
Next: Invoices and Payments Management Up: Order Management Previous: Returning an item